


Filters
Stock videos of Diagram
Find the right royalty-free footage and animations with Diagram for commercial use.

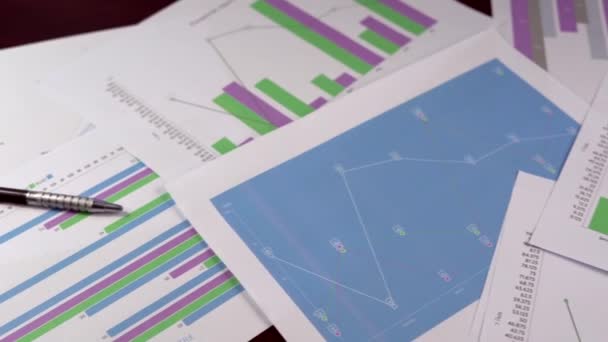
Business Statistics, Market Data And Infographics Layout/ 4k animation of a set of design business and market data analysis and reports, with infographics, bar stats, charts and diagrams

Dashboard infographic animation in motion graphics 2d with statistics graphs. Pie charts, workflow, and UI elements.

Dashboard infographic animation in motion graphics 2d with statistics graphs. Pie charts, workflow, and UI elements.

Futuristic graphs and charts, futuristic user screen interface with graphs, lines, surfaces, motional and colorful diagrams, animated dashboard, marketing and information technologies. High quality 4k

Animated dashboard, marketing and information technologes, futuristic user screen interface with graphs, motional and colorful diagrams, charts. High quality 4k footage

Bar and circular graphs. Graphs and business concepts.

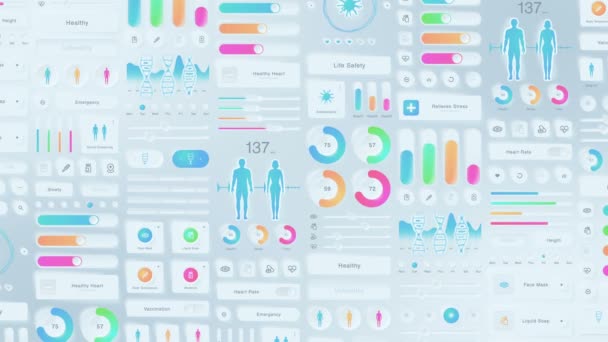
Creative design of medical application. Neumorphism. Hi tech panel. Medical and health concept. UI, UX, GUI mobile screens modern infographic. Loop animation.

Company sales in 2020. Company growth.

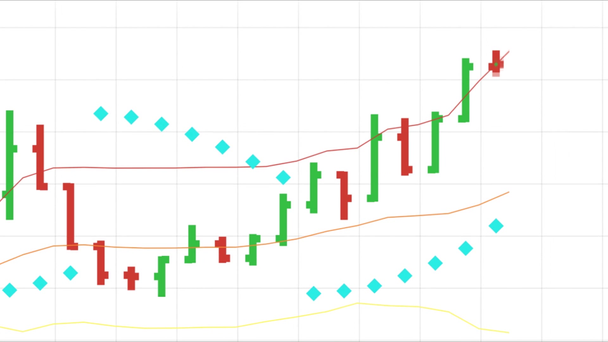
A set of animated decorative color line and candlestick graphs on the white background.
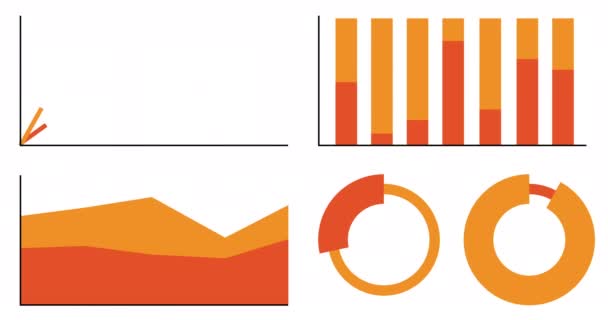
Animated Infographics set. Animation of Four different charts and graphs in orange color isolated on white background. High quality 4k resoluton footage.

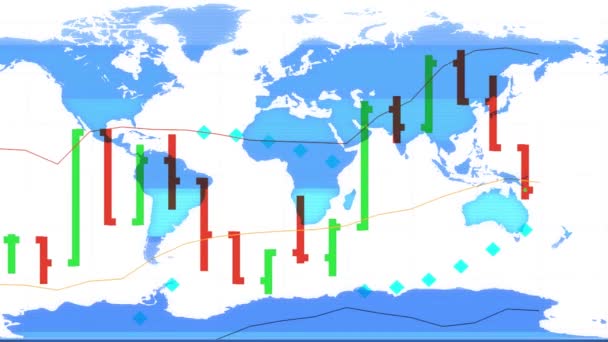
4k Business Data Graph with world map background,Financial figures and diagrams showing increasing profits.

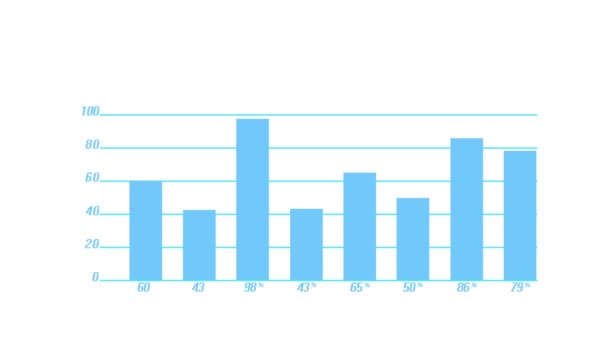
1920x1080, 1080p, full hd, growing chart on white bg

Bar graph and line graph. Concept of interest rate change and yield change.

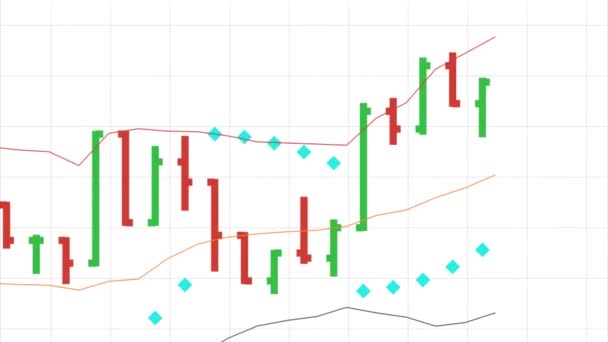
Stock market charts on a white background.

Creative design of medical application. Neumorphism. Hi tech panel. Medical and health concept. UI, UX, GUI mobile screens modern infographic. Loop animation.

Universal stock market price chart on white background - new quality financial business animated dynamic motion video footage

Several color graphs animated on the white background.

Quarterly evaluation of sales targets. Transparent display of results in a bar graph.
Universal stock market price chart on white background - new quality financial business animated dynamic motion video footage

Bar graph and line graph. Concept of interest rate change and yield change.

Company sales in 2021. Company growth.

Statistics bars graphic information ,4k video animation

Multiple thick circular statics progress bar animation. Isolated on white background.

World economy index market chart and ticker board quotes on background - new quality financial business animated dynamic motion video footage
Green Arrow Climbing Higher on blue Bars Chart in a loop

Business Statistics, Market Data And Infographics Layout/ 4k animation of a set of design business and market data analysis and reports, with infographics, bar stats, charts and diagrams
Creative design of medical application. Neumorphism. Hi tech panel. Medical and health concept. UI, UX, GUI mobile screens modern infographic. Loop animation.

Animated 3D bar graph - different colors - green screen
Universal stock market price chart on white background - new quality financial business animated dynamic motion video footage

Business Chart 3D, Growing success, profit, money graph , business , chart , growth , finance , profit, stock , market

Four growing graph charts on a grid with a gridded background

Universal stock market price chart on white background - new quality financial business animated dynamic motion video footage
4k Business Data Graph,Financial figures and diagrams showing increasing profits.

4K financial stock chart,Business digital Data trend hud Graph,Stock Market,Changing Economic node line.
Arrow Climbing Higher on a Bar Chart in a loop

Finance growth, Business data, showing on pie and linear graph charts, animations of motion graphic, symbolizes successful business.
Forex stock market chart and holographic earth map on background - new quality financial business animated dynamic motion video footage

Flight around growing bar and pie charts with sheets of the financial report

Fluctuating bar graphs and line graphs. Graph of rising and falling repeatedly.

Universal stock market price chart on white background - new quality financial business animated dynamic motion video footage

Tri-circular statics progress bar animation. Isolated on white background.
3D chart with upwards arrow, white background - great for topics like finance etc.

Business diagram on a white background

Growth up stock markets chart 3d loop animation. Success, rising business and financial graph, economy data diagram and money investment analysis loopable and seamless abstract concept.
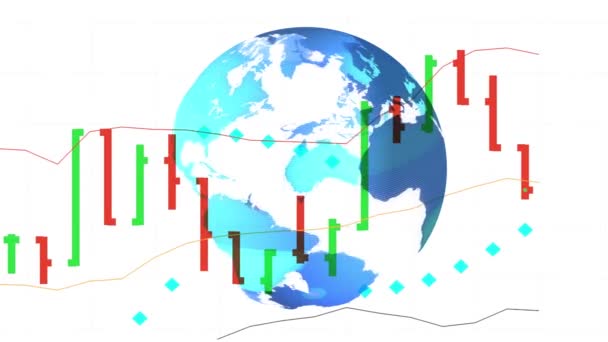
Forex stock market chart and HUD earth map on background - new quality financial business animated dynamic motion video footage

Creative design of fitness application. Neumorphism. Hi tech panel. Running and sports concept. UI, UX, GUI mobile screens modern infographic. Loop animation.

Bar graph depicting grow

1920x1080, 1080p, full hd, the camera looks at the growing chart on white

Business Statistics, Market Data And Infographics Layout/ 4k animation of a set of design business and market data analysis and reports, with infographics, bar stats, charts and diagrams

Infographic elements. Round business diagram. Percent table. Marketing plan. HD video with alfa

Moving buisness diagram on white

Pie Chart Rising on white background

Circle diagram for presentation, Pie chart indicated 10-90 percent, and various graphic diagram.

Single line chart wit progress evaluation. Data analysis on black flip chart.

Animation of financial charts and annual report on dark background. Ready to use mock up

Circle diagram for presentation, Pie chart indicated 10-90 percent, and various graphic diagram.

Business concept with piles of coins and graphs. A graph of changes in the price of a financial stock exchange.

Business growing chart. Blue graph with world map in background 3d loopable and seamless animation. Success, stock exchange, rising markets, financial and economy abstract concept.

Circle diagram for presentation, Pie chart indicated 10-90 percent, and various graphic diagram.

CG Footage business chart blue tone camera movement.

Bar Chart - Falling Down on white
Yellow Pie chart infographic icon isolated on grey background. Diagram chart sign. 4K Video motion graphic animation.

Falling circle cylinder diagram on economic graph, financial chart, for presentation templete

Creative design of fitness application. Neumorphism. Hi tech panel. Running and sports concept. UI, UX, GUI mobile screens modern infographic. Loop animation.

Creative design of medical application. Neumorphism. Hi tech panel. Medical and health concept. UI, UX, GUI mobile screens modern infographic. Loop animation.

Universal stock market price chart on black background - new quality financial business animated dynamic motion video footage

A fluctuating bar graph and a flowing line graph. Concepts about the graph of variation and prediction.

Circle diagram for presentation, Pie chart indicated 10-90 percent, and various graphic diagram.

Animation of the stock market trends

Universal stock market price chart on white background - new quality financial business animated dynamic motion video footage

Economic graphs with animations of stacks
Business data graph chart drop down footage clip

Futuristic user interface with HUD and infographic elements. Looped motion virtual technology background. Intelligent head-up display dashboard for business, games, motion design, web and app.

Business data bar graph chart diagram. Grow chart business concept.

Creative design of medical application. Neumorphism. Hi tech panel. Medical and health concept. UI, UX, GUI mobile screens modern infographic. Loop animation.

Animated Infographics set. Animation of six different charts and graphs in bright color isolated on white background. High quality 4k motion design.

Economic graphs with animations of stacks

Circle diagram for presentation, Pie chart indicated 10-90 percent, and various graphic diagram.

Statistics infographic data animation with pie and speech bubble ,4k video animated
Blue Pie chart infographic icon isolated on orange background. Diagram chart sign. 4K Video motion graphic animation.

Circle diagram for presentation, Pie chart indicated 10-90 percent, and various graphic diagram.

Graph - 12 Months (Green)

Double line chart with comparison. Business data analysis in software.

Bar graph and circular graph and line graphs with pile of coins. Concept on investment analysis.

Stock crash market exchange loss trading graph analysis investment indicator business graph charts of financial digital background arrow down stock crisis red price in down trend chart fall 3d render

Circle diagram for presentation, Pie chart indicated 10-90 percent, and various graphic diagram.